I originally wrote about the 95th Percentile calculation several years ago as a Tech Tip for the Netcordia web site. It is time to talk about 95th percentile here, where it can continue to be a resource for network administrators. I’m taking this time to expand on the topic, hopefully making it clearer and providing more references.
Network administrators need to have some way to identify high link utilization. Average and peak link utilization either under state or overstate the real link utilization. How should true link utilization be determined? Is more bandwidth is needed or should the traffic be subject to bandwidth shaping? The 95th percentile calculation provides a good measure of utilization for most traffic flows, particularly where there are bursts of traffic or where there are long periods of little traffic. When used for billing purposes, it may result in over-billing. But when used to identify links that are starting to become congested during certain hours of operation, it is preferable to other mechanisms.
The algorithm is as follows:
- Collect all the data samples for a period of time (commonly a day, a week, or a month).
- Sort the data set by value from highest to lowest and discard the highest 5% of the sorted samples.
- The next highest sample is the 95th percentile value for the data set.
The link is running at the 95th percentile utilization value or higher for 5% of the time over which the samples were collected. On a minute-by-minute basis over 24 hours (1440 minutes), 5% of the total time is 72 minutes (1440 * .05 = 72). Therefore, the link was running for 72 minutes at, or above, the 95th percentile utilization value. If your sampling interval is longer, say 15 minutes, then you only have 96 samples. Doing the calculations, 96 * .05 = 4.75, which rounds up to 5. So you discard the top 5 samples and use the value of the 6th sample in the sorted list. Since each sample represents 15 minutes, you are discarding 5 * 15 minutes of data, or 75 minutes of samples (versus the 72 minutes of data if you use 1 minute samples).
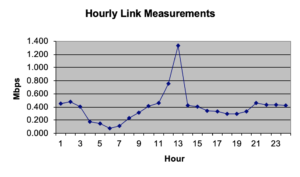
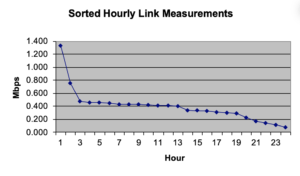
Let’s look at an example. In the charts below for a theoretical T1 link, we see peak and average utilization of 1.32Mbps and 0.27Mbps, respectively. There are 24 samples, so 5% of the samples is one sample (24 * .05 = 1.2, which rounds to 1). So we discard one sample. The 95th percentile utilization is the value of the next highest value, or 0.75Mbps.
Why do I like the 95th percentile metric? Well, 72 minutes is only 20% longer than an hour, so the 95th percentile approximates the busy-hour of a link. It is the minimum utilization of the link for over an hour. If I see a link whose 95th percentile utilization is greater than 75% of link capacity, I start investigating it. Is it peaking during business hours and limiting productivity of applications using the link? Or is it peaking during night-time backup operations and increasing the time that it takes backups to complete. In either case, the link is a candidate for bandwidth upgrade soon.
Other definitions and use of 95th percentile:
- Wikipedia has a good article on billing based on 95th percentile. http://en.wikipedia.org/wiki/Burstable_billing
- If you are mathematically inclined, here is the complete coverage of percentiles in general. http://en.wikipedia.org/wiki/Percentile
-Terry
_____________________________________________________________________________________________
Re-posted with Permission
NetCraftsmen would like to acknowledge Infoblox for their permission to re-post this article which originally appeared in the Applied Infrastructure blog under http://www.infoblox.com/en/communities/blogs.html


