
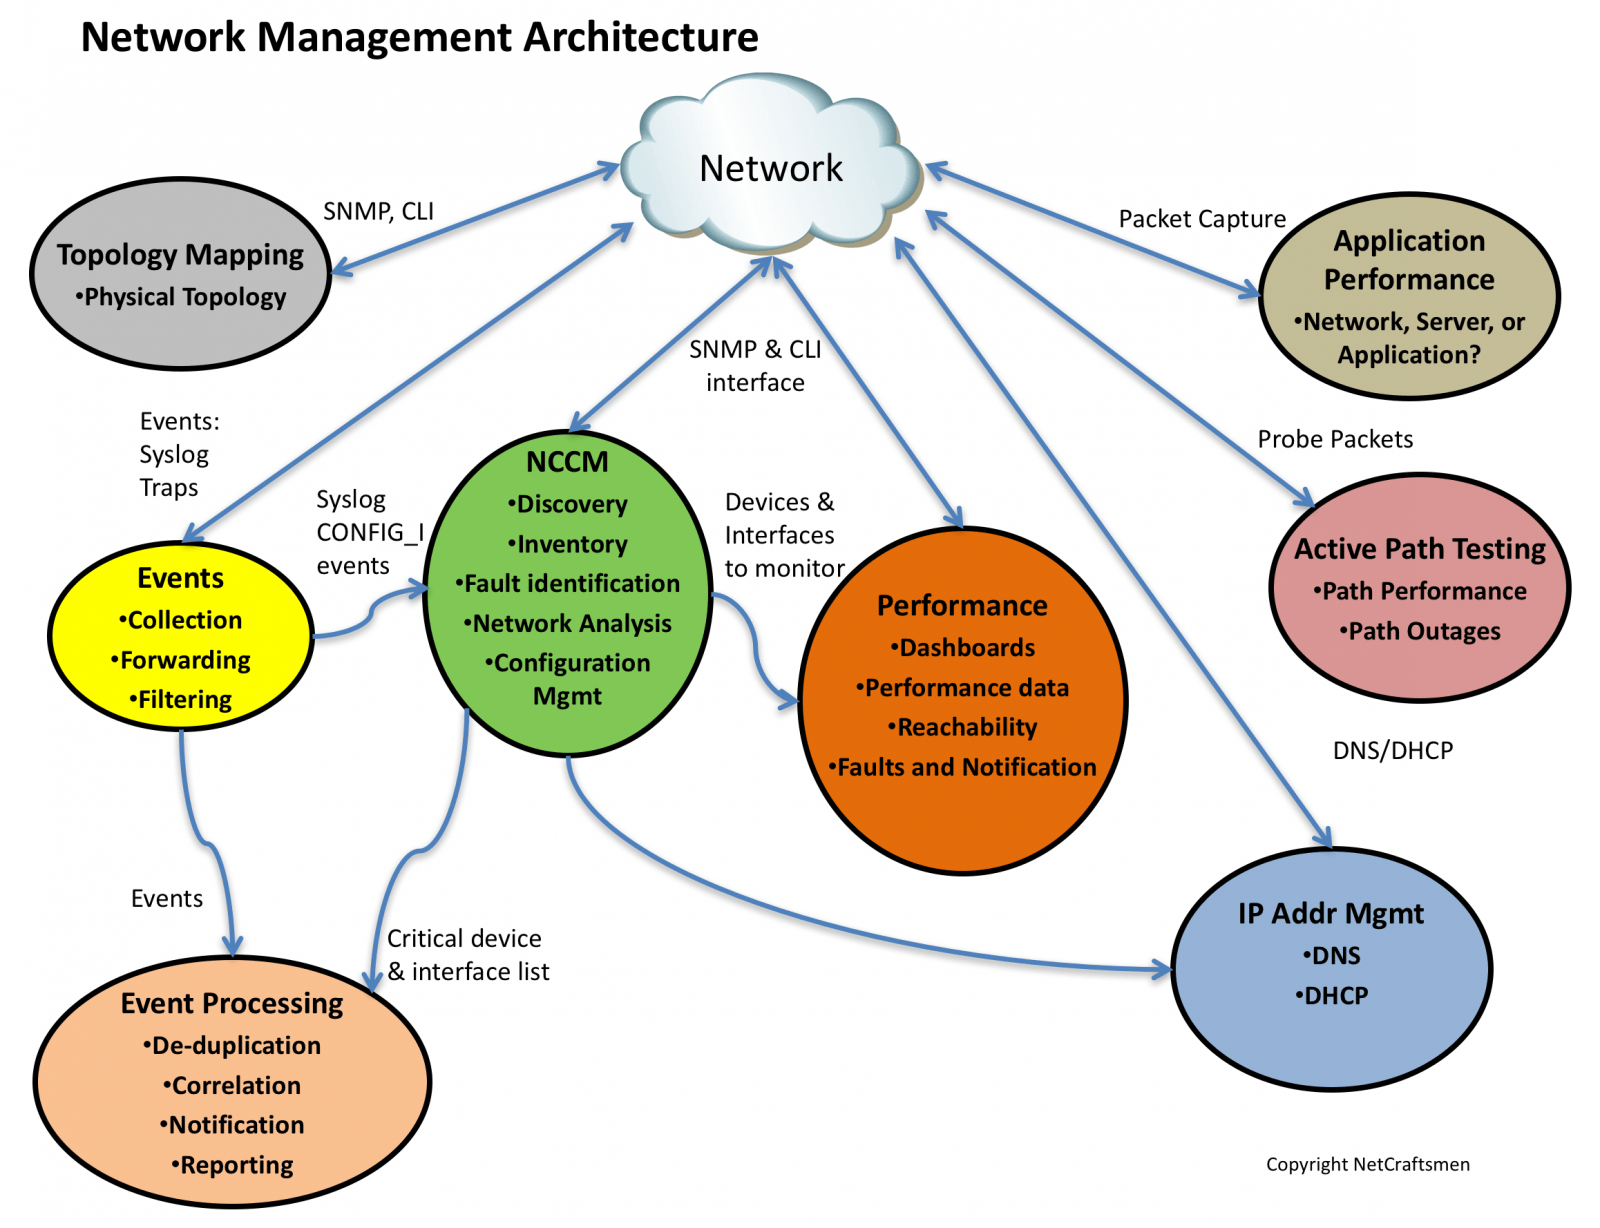
This is the third of a series of posts on the network management architecture used by NetCraftsmen in our network assessments. The architecture consists of seven elements, shown below.
Active Path Testing
Network management systems tell us how the network devices are operating. But they often don’t tell us what the applications experience as their packets transit the network. The applications are what the business relies upon to remain viable, so it is essential to know what the applications are experiencing.
Active path testing generates synthetic transactions to measure a path’s operational characteristics, such as delay, jitter, and packet loss. Some tools can show path capacity (how much bandwidth a path has) and utilization (how much of the bandwidth is being used). In the figure below, we see that a path had continuously high utilization until May 26. Something was consuming bandwidth on the path until that date. Other tests that originated from the same facility also showed high utilization, indicating that the problem was within that facility.
The key to using an active path testing tool is to instrument the network in a way that allows you to determine where a network problem is occurring that is impacting an application. If a path that is six hops long is being monitored and a problem is detected, how can the hop that is causing the problem be identified?
We recommend creating a set of path tests that allow problems that are common to each hop to be identified by correlating the data from multiple path tests. In the figure below, Path Testing Deployment Design, we recommend a full mesh of tests between the three appliances, shown as green circles. Sites 1, 2, and 3 are the main data centers in which most application servers are located. The full mesh of tests monitors the backbone links and the Site N Distr to Site N Core links. Within each data center site, configure tests from the test appliance at that site to other targets within the site. That tests intra-site paths.
Finally, configure tests from each Data Center Site N to targets at the remote sites. If a site is dual-homed, there may need to be some policy-based-routing implemented to force some test traffic over a specific path. Or perhaps a remote target needs to be specified that will always prefer a given path, assuming normal routing and no network failures.
Create alerts to be sent when a path fails or when one of the operational characteristics exceeds normal operating parameters. If a link experiences a failure, an alert should be generated. Multiple alerts would mean that a core link that is part of multiple tests has failed.
With the structured approach described here, the number of tests is minimized. If you have clearly identified the tests and created a spreadsheet that documents the tests and the links that are tested, you will be able to easily tell which link is causing problems due to the alerts that are generated.
Application Performance
While active testing checks the paths, there is still a need to look at the applications themselves. This class of tools will need to capture packets and be able to see part of what is happening within the packets. While this analysis could be done with Wireshark or Sniffer, it would be extremely tedious.
The application performance monitoring tools understand applications running on the network and are able to show the applications that are running (within the limits of packet decoding) and associate clients with servers. A good system will be able to report on network delays, packet loss, jitter, server delays, and client “think time” delays. On several occasions, we’ve found significant server delays, which absolved the network team of any responsibility for the slowness. Extending the packet capture to the server farm allows the system to help identify which server out of a multi-tier implementation (application server, middle-ware server, or database server) is contributing to the delays.
Another characteristic of these tools is the ability to see classes of applications, determined by protocol and/or endpoints. At one site, we found a saturated link on which 50% of the traffic was originating from three sources over HTTP: Pandora (streaming audio), Akamai Networks (audio and video streaming and downloads), and LimeLight Networks (audio and video streaming and downloads). We named this traffic “entertainment traffic”. The entertainment traffic was choking out the business traffic. Due to organizational policies, it couldn’t be stopped, so we applied QoS. The Internet entertainment traffic was prioritized into a low priority queue that was only allowed to use remaining available bandwidth. The complaints about slow application performance stopped.
The application performance management tools, because they do packet capture, can also see packet loss in some protocols, such as TCP or VoIP. These protocols contain sequence numbers that indicate the order in which the packets were sent, so that if they are received out of order, they can be reassembled in order. In TCP, there’s another use: identifying packets that need to be retransmitted because the original packet was dropped (typically due to link errors or a lack of buffers or due to congestion). Regardless of the cause, it is important to know that key business applications are experiencing packet loss. (See my blog TCP Performance and the Mathis Equation.) If packet loss is detected, then check the interfaces along the path for errors and drops. The packets are being lost somewhere in the path and it is simply a matter of finding where it is happening. Note that identifying TCP retransmissions is something that Wireshark or similar tool could perform without needing to decode the application. Or the server team could check for TCP retransmissions on the servers and on the clients that are experiencing problems. If SNMP were enabled, the NMS tools may even be used to gather this fundamental data.
In my next post, we’ll cover Topology Mapping and wrap it up.
-Terry
Other posts in this series:
Re-posted with Permission
NetCraftsmen would like to acknowledge Infoblox for their permission to re-post this article which originally appeared in the Applied Infrastructure blog under http://www.infoblox.com/en/communities/blogs.html.